
AIDS deaths

AIDS deaths

Interactive Data Dashboards

Track the HIV & TB response

Key indicators, province breakdowns and downloadable graphs.

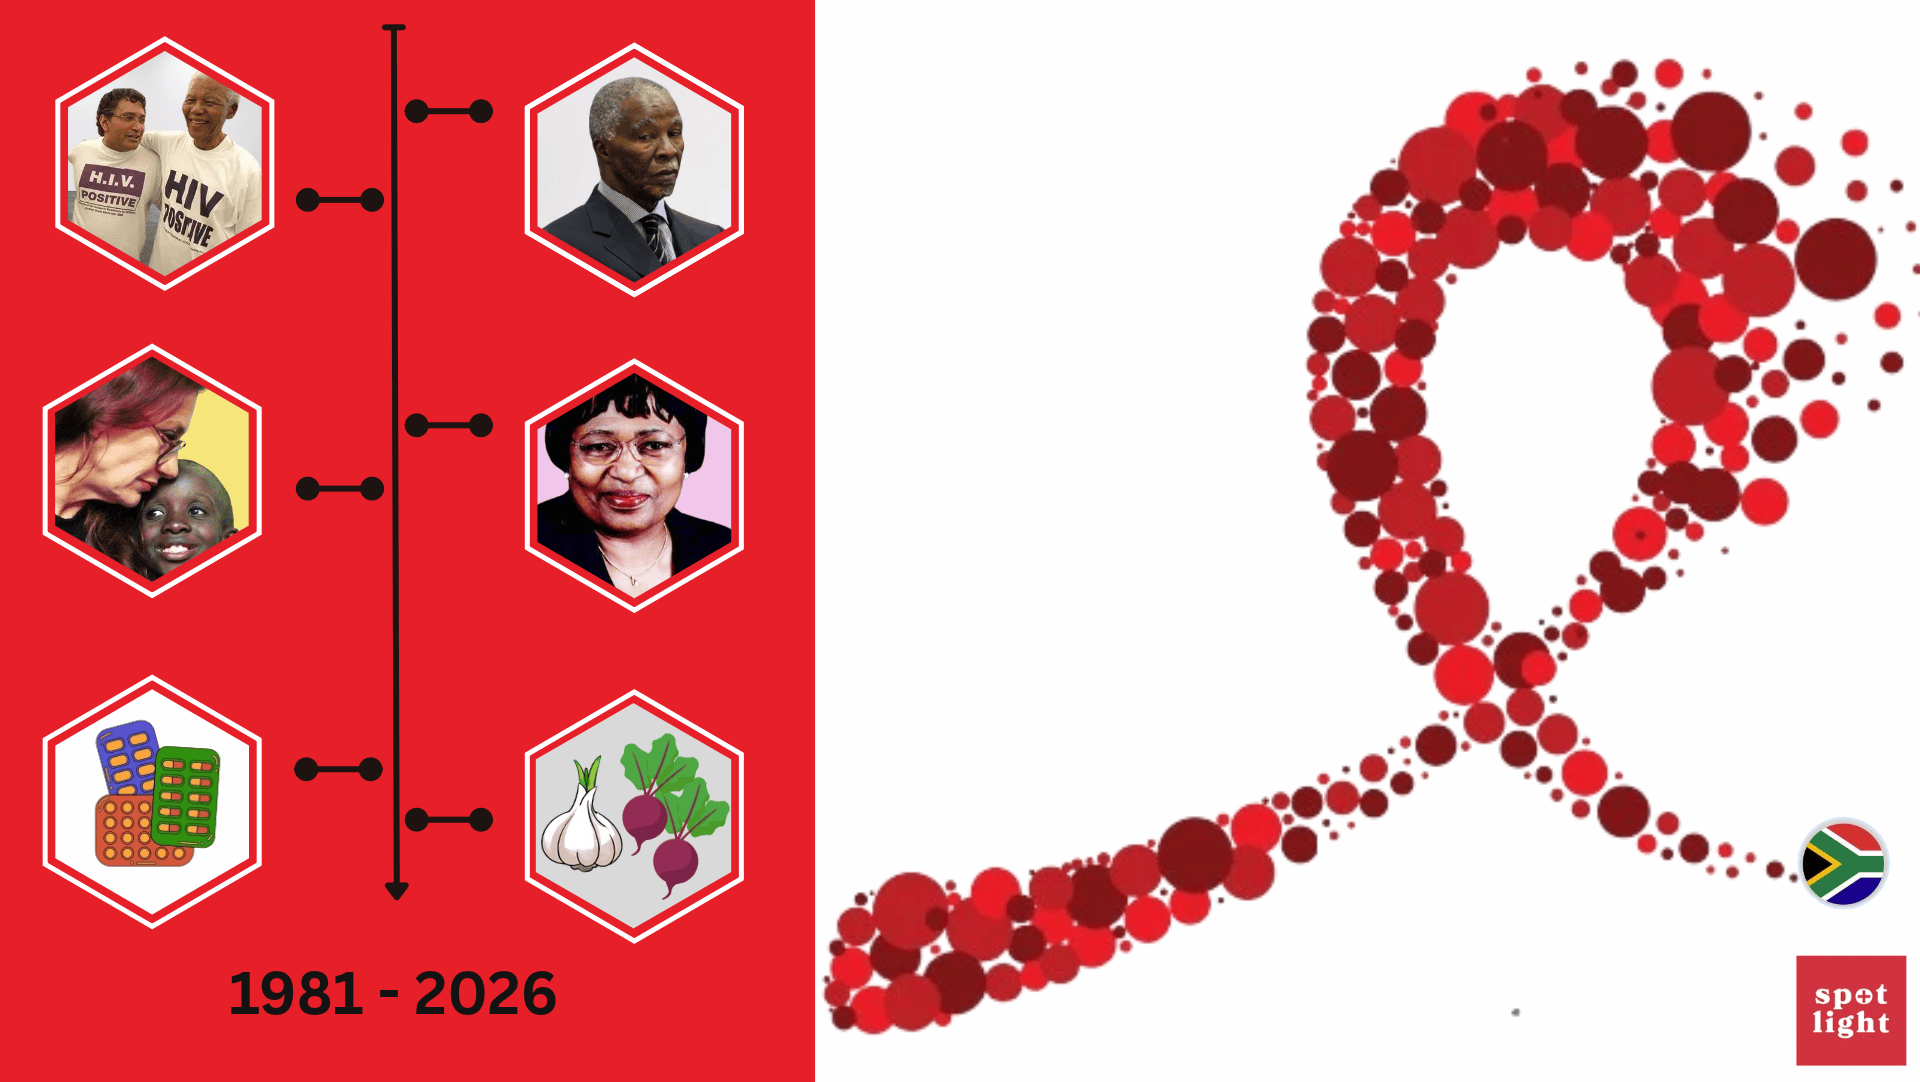
  • TIMELINE | The journey of HIV through science, struggle, activism, and hope

    From the first reported cases of HIV in 1981 to the latest breakthroughs in long-acting prevention, this Spotlight timeline traces key moments in the global and South African response to the virus. It highlights scientific milestones, political controversies, activism, and the human stories that shaped one of the most significant public health challenges of our…

    ·

  • Spotlight launches new HIV dashboard

    Spotlight has launched a new HIV dashboard and graph generator based on outputs from the Thembisa model. Our hope is that this dashboard will help the public and people working in healthcare to find important HIV numbers more easily. Please take a look and let us know what you think of it.

    ·